
Sentiment analysis involves analyzing the opinions about a product or service expressed in the form of a text and categorizing those opinions to draw meaningful insights. Generally, these opinions are categorized into positive, negative, or neutral.
Sentiment Analysis Using Python Overview
In this blog, we’ll build a 2-way polarity (positive, negative, or neutral) classification system for stock prices based on the news headlines without using NLTK’s (Natural Language Toolkit) in-built sentiment analysis engine. We will use a Logistic Regression classifier, Bag-of-Words features, Random Forest classifier, and Multinomial Naive Bayes classifier. To see which performs best, we will also create our preprocessing module to handle raw news headlines.
Data Used
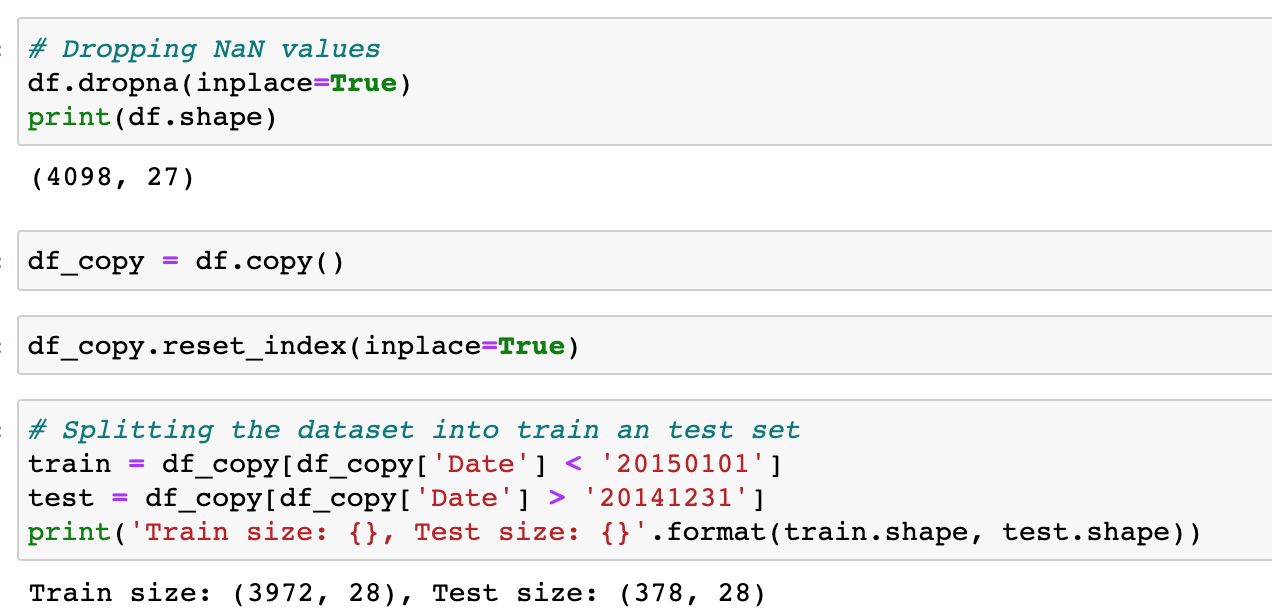
- The news headlines dataset has 4,100 rows and 27 columns
- Each row has the date of headlines, label (0 – Stock price goes down or stays the same, 1 – Stock price goes up), and top 25 headlines.
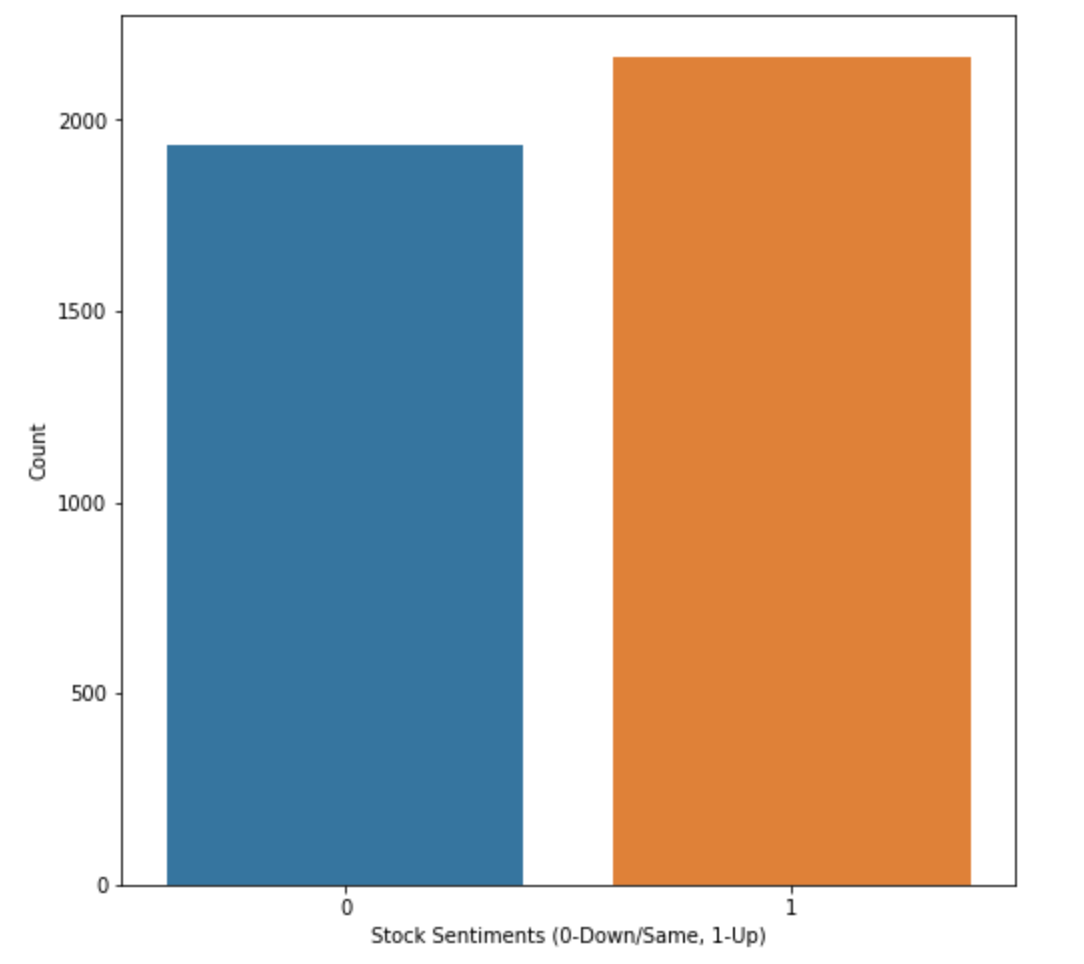
- Positive stock sentiment is slightly higher in the given dataset
Data Cleansing and Preprocessing
The first thing that we’ll do is to clean the data by filtering out null values and then preprocessing the headlines so that they’re easier to deal with and ready for feature extraction and training by the classifiers.
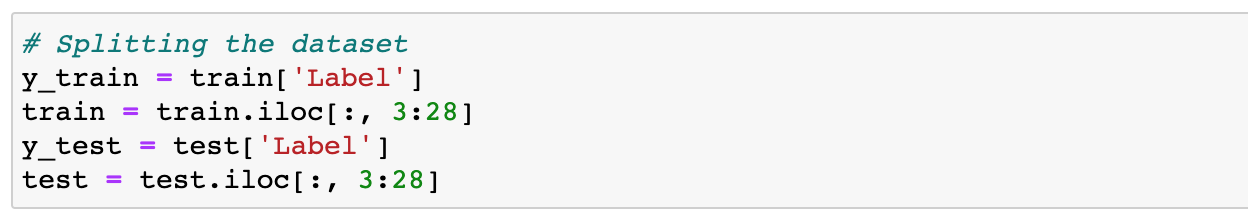
After cleaning the data, we’re going to split the data into train and test sets and extract the labels from both sets.
Split the data sets to extract Y labels.
Then for the preprocessing, we’ll first install NLTK libraries to process the data sets.

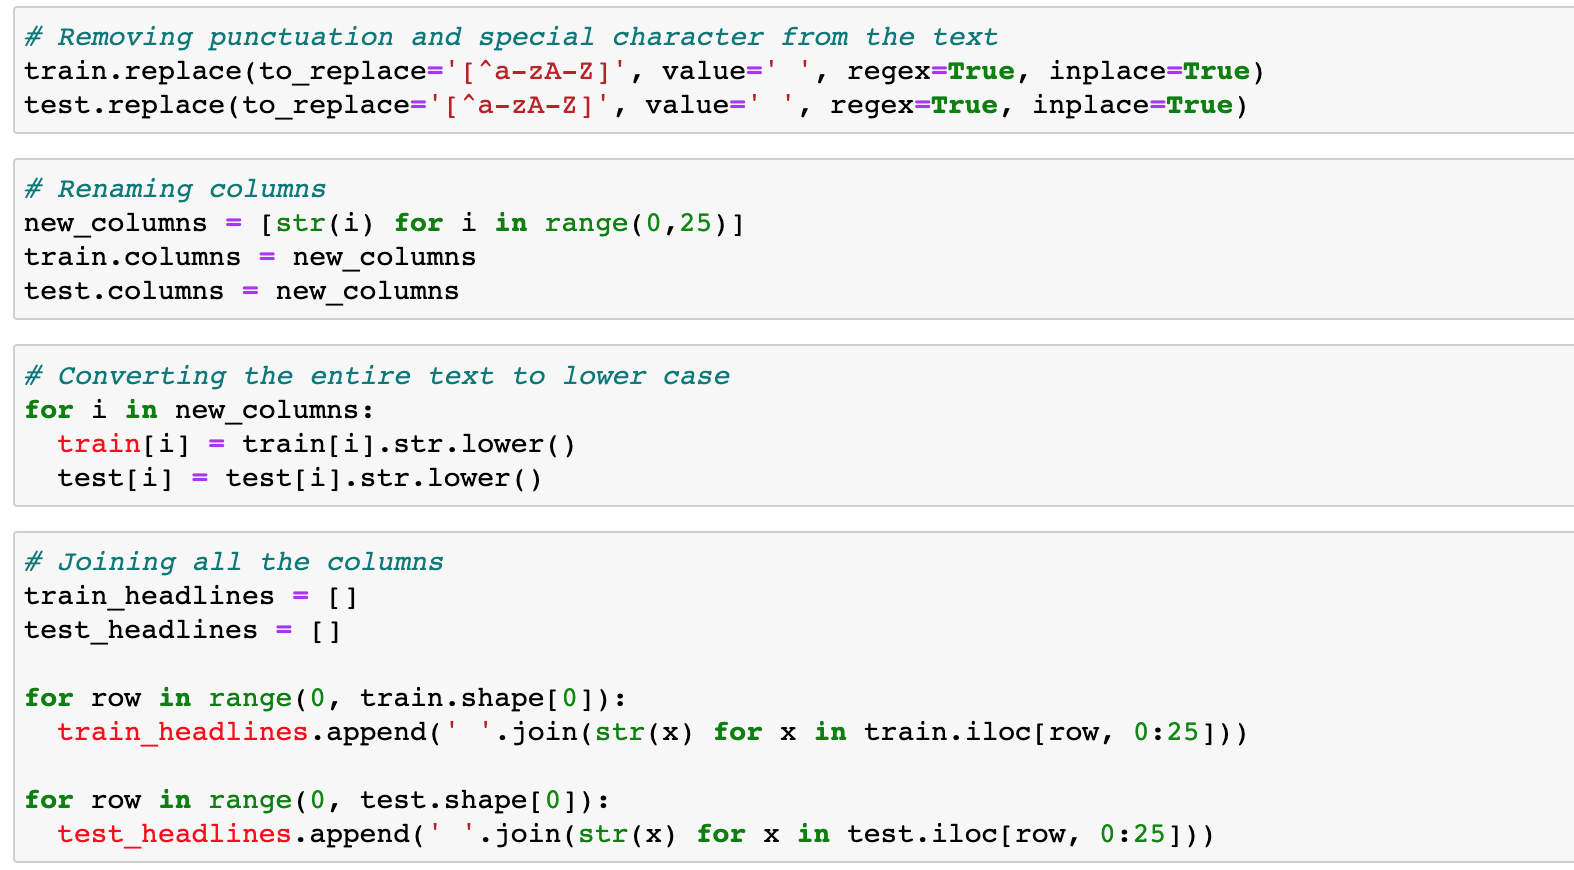
Next, we remove special characters and punctuation marks, rename columns and make all words lowercase. Finally, we combine all the columns into one.
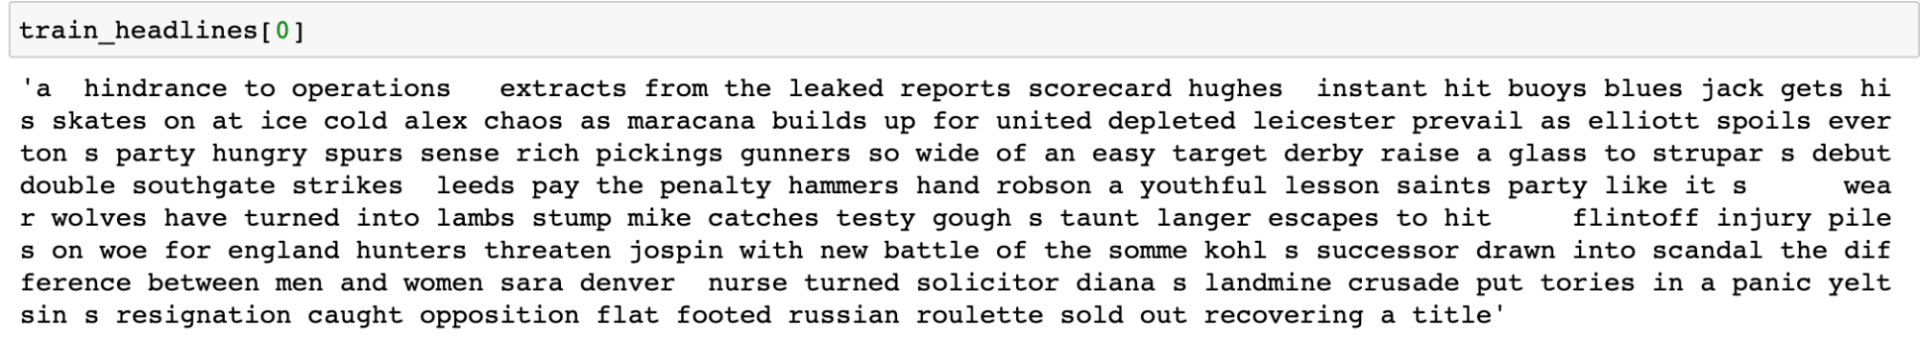
After the above steps, the final output will be as follows:
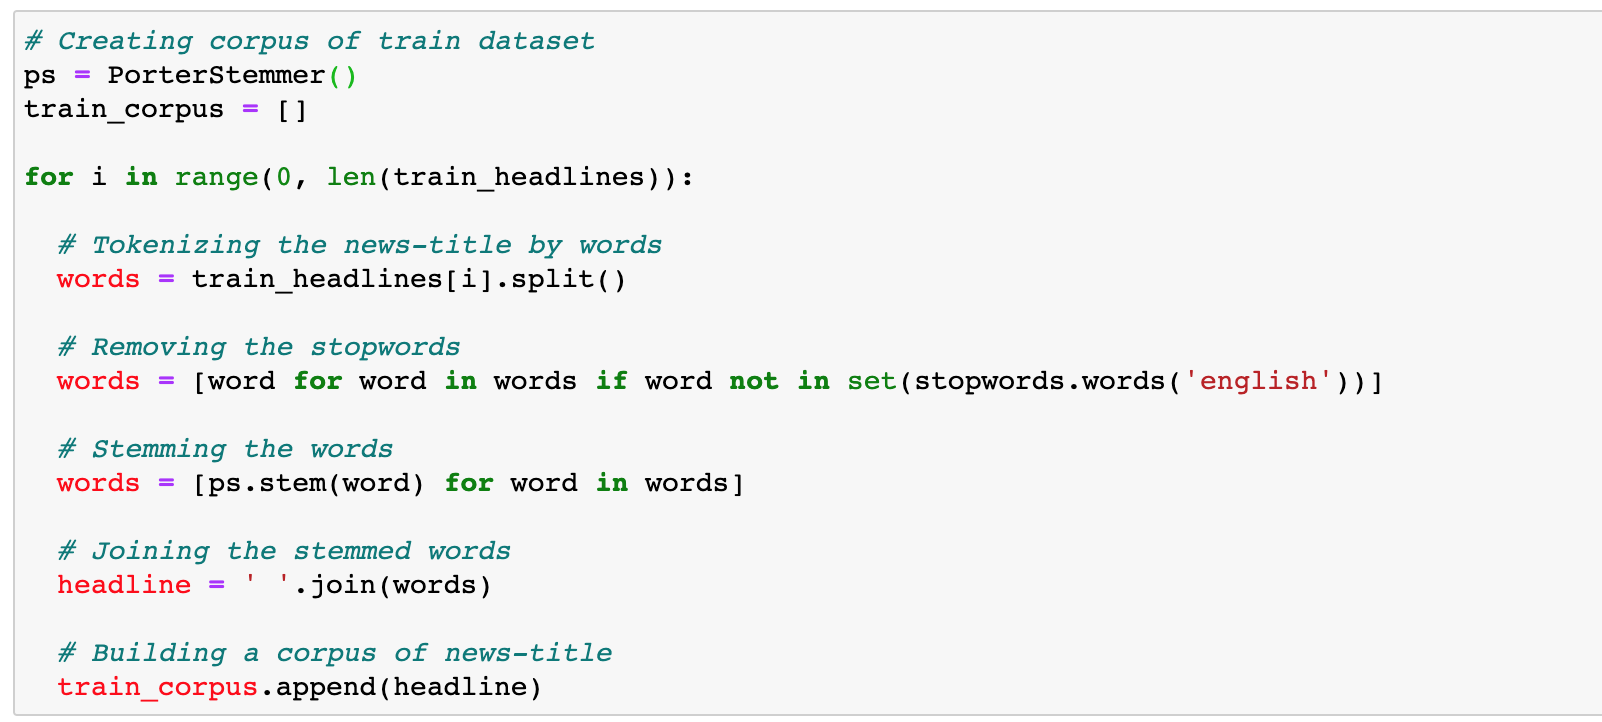
Now, we create a word corpus by tokenizing the preprocessed headlines, removing stop words and joining the stemmed words.
Similarly, we can create a corpus for the test data set as well.

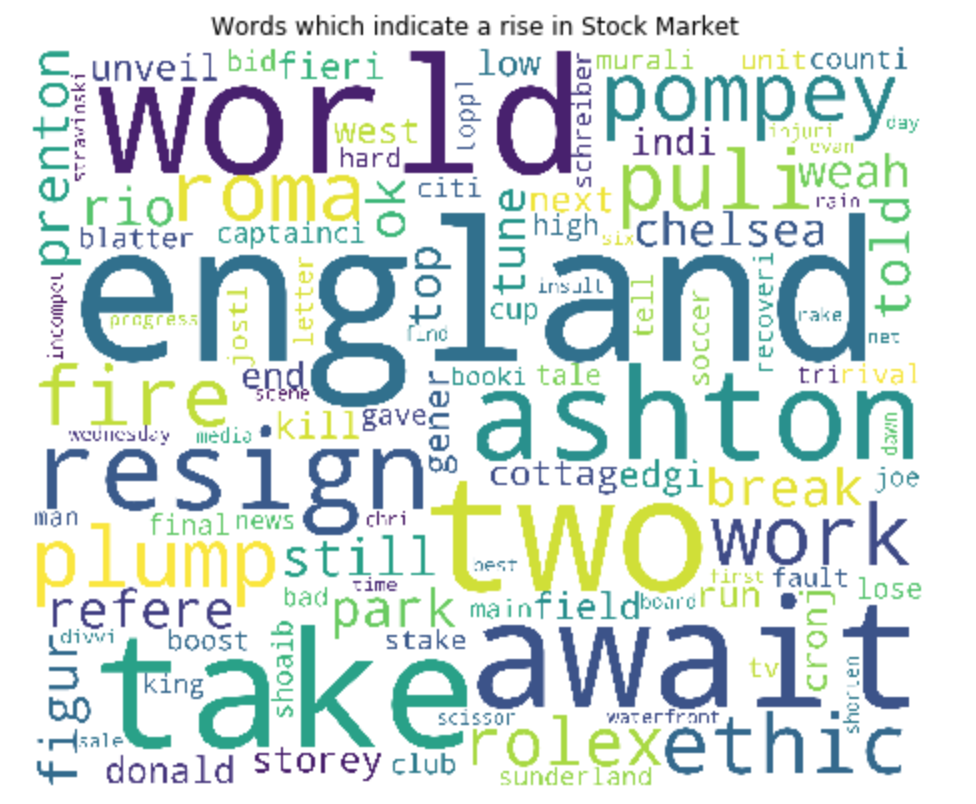
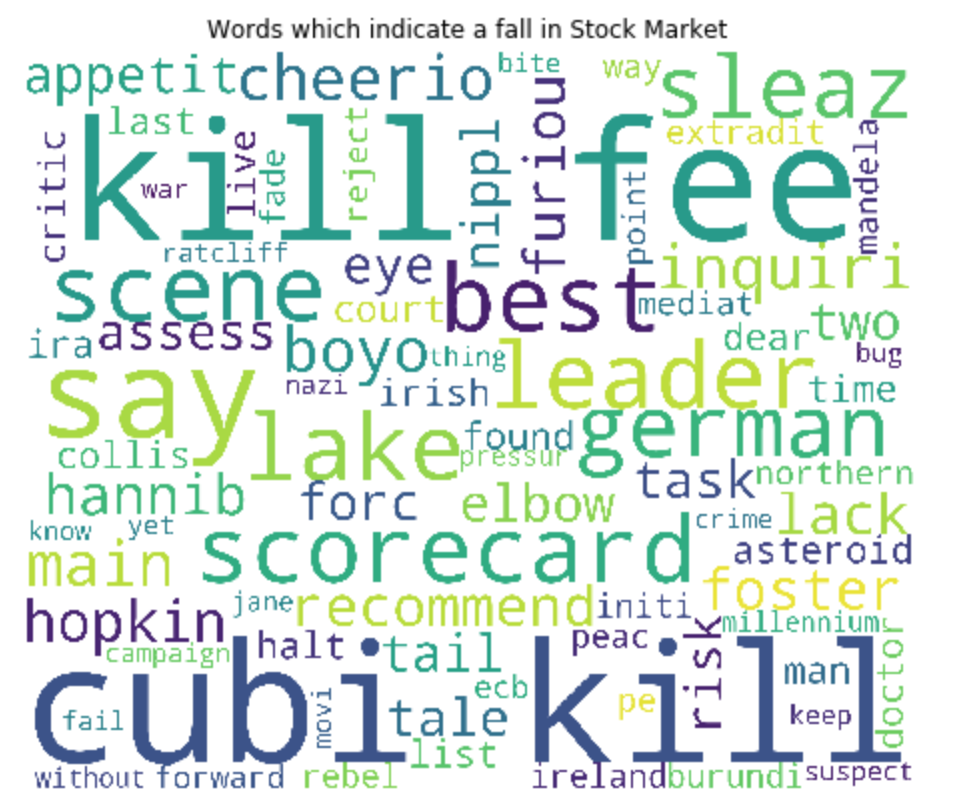
From this corpus, we can create a word cloud of down words (negative impact on stock market) and up words (positive impact).
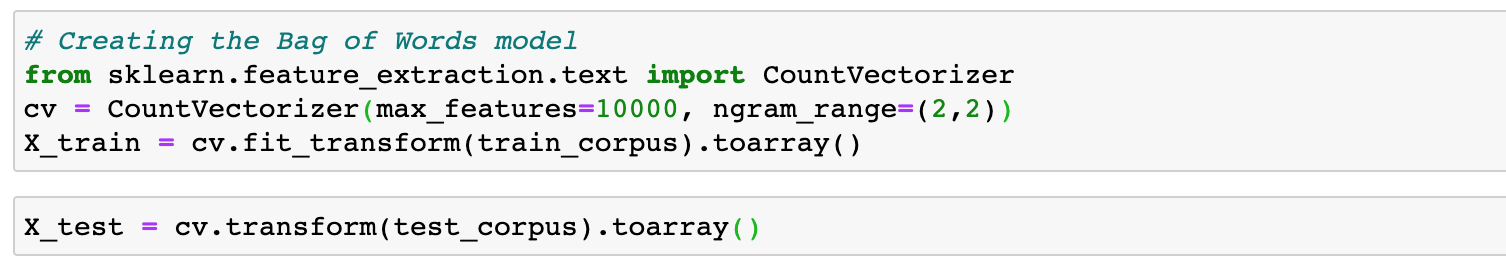
With the available corpus, we extract features by using a bag of words model that can be used with machine learning algorithms to calculate scores.
Model Building
Now, we will run our data through a Logistic Regression, Random Forest classifier, and Multinomial Naive Bayes classifier. We also calculate the performance measures like accuracy, precision, and recall for the corresponding algorithms to select a model with the best results.
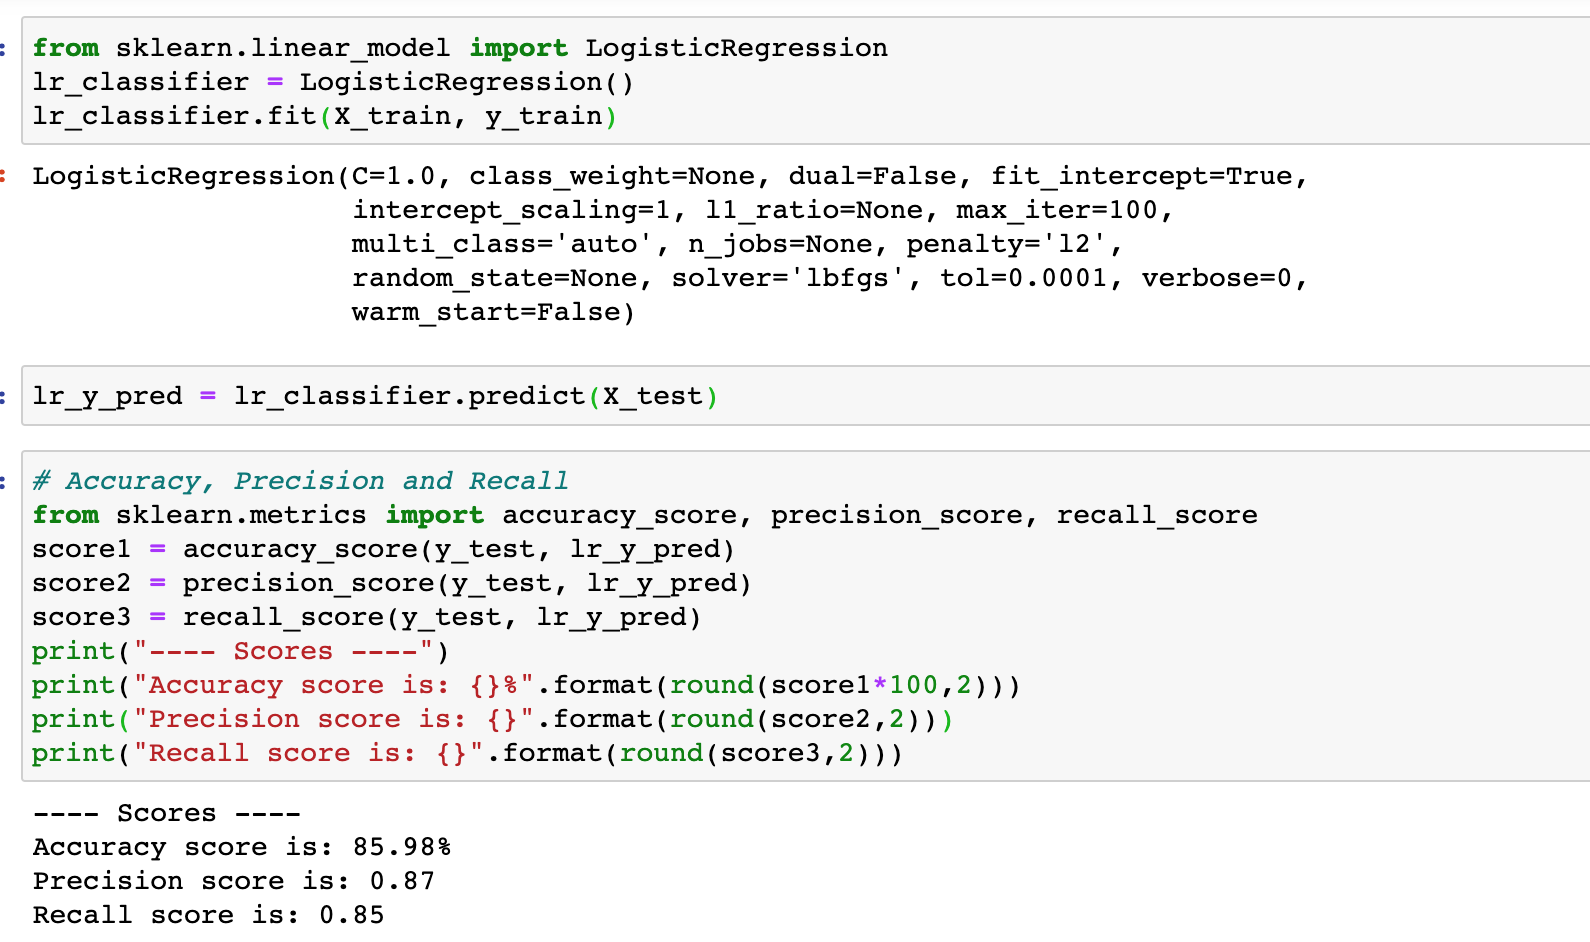
Logistic Regression
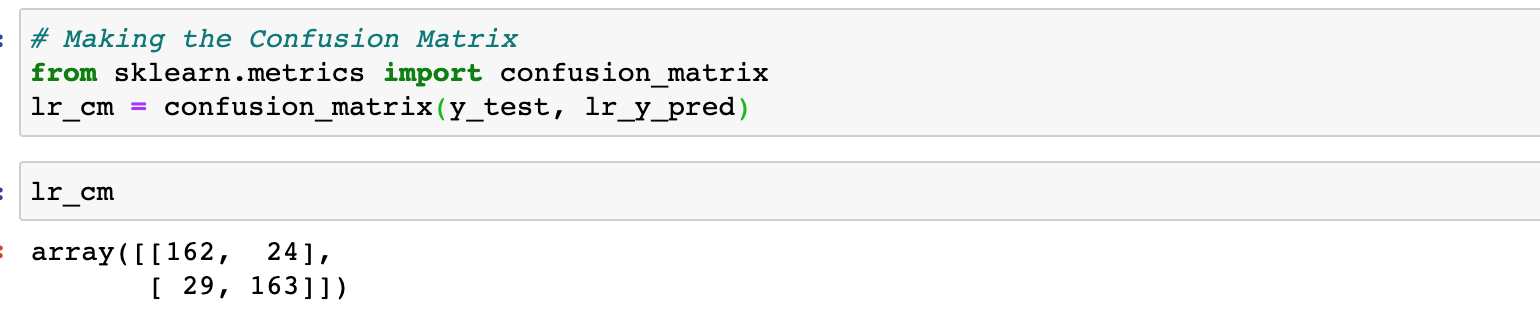
Confusion matrix is a performance measurement for classification algorithms. It is a matrix that gives a visual representation of True Positives (TP), False Positives (FP), True Negatives (TN), and False Negatives (FN).
- Accuracy (all correct / all) = TP + TN / TP + TN + FP + FN
- Precision (true positives / predicted positives) = TP / TP + FP
- Recall (true positives / all actual positives) = TP / TP + FN
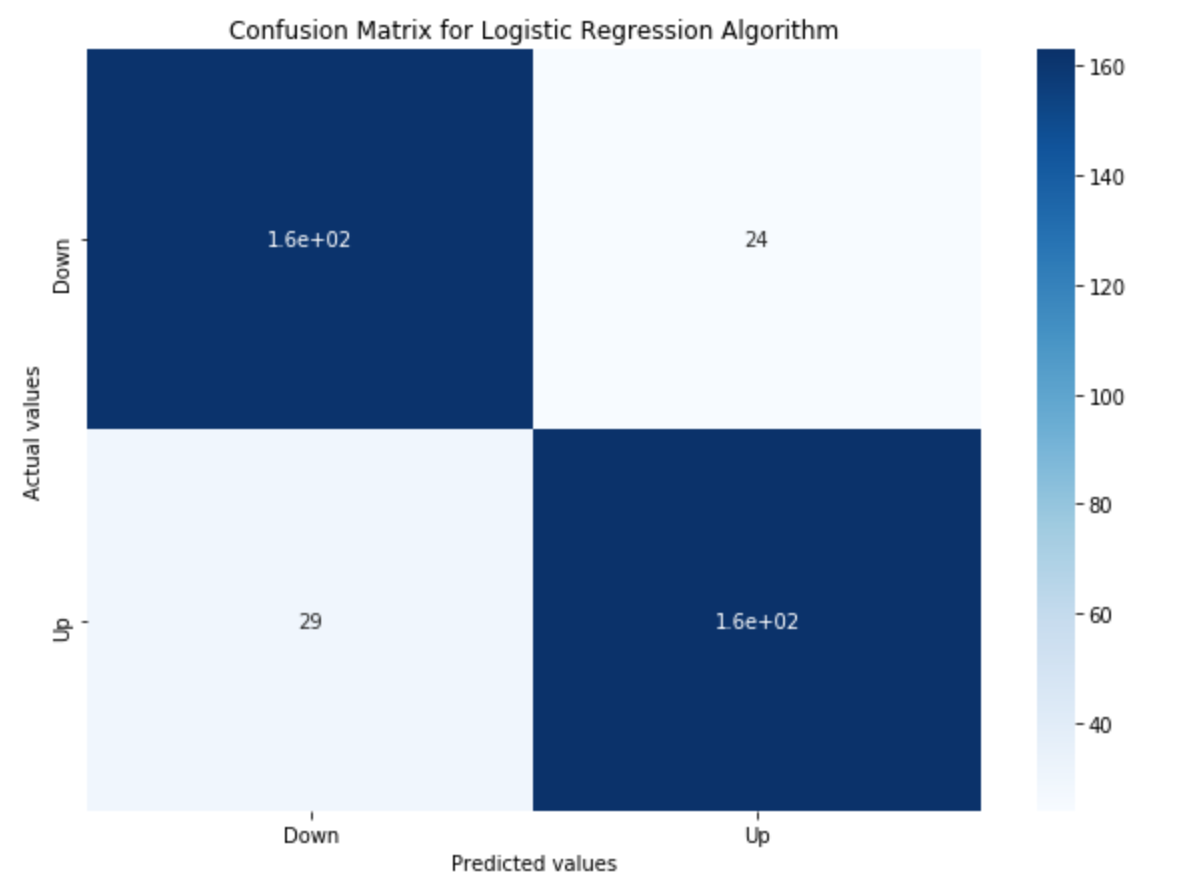
Logistic regression gave us an accuracy of 86% which is a great start. We continue to use other algorithms to see if they give better results.
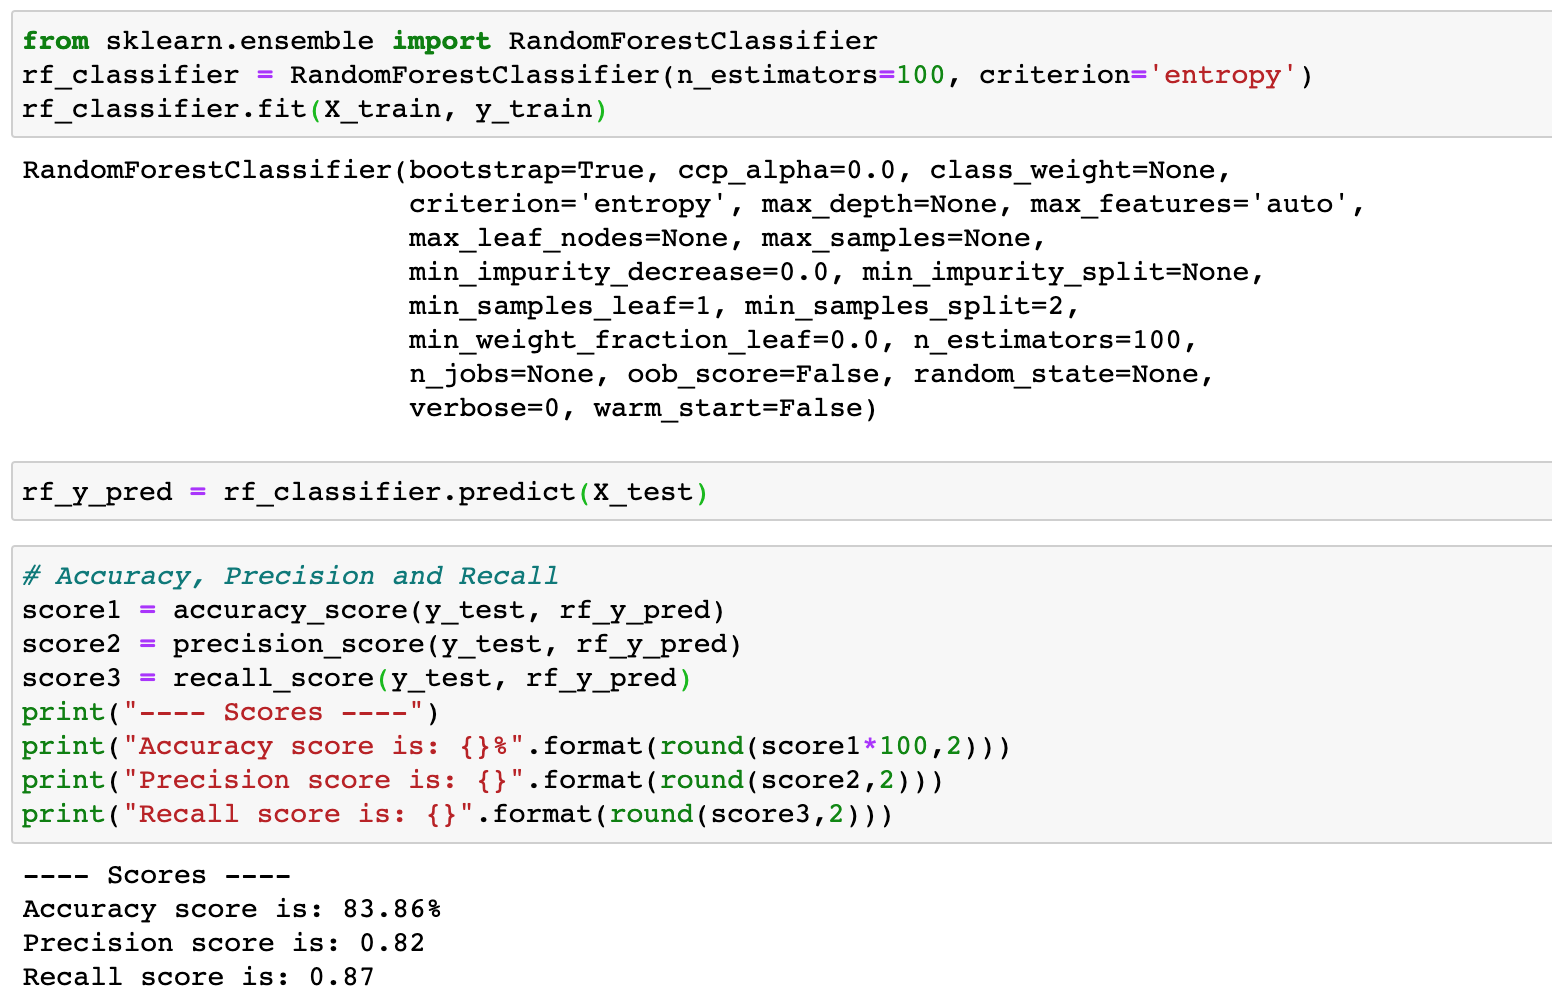
Random Forest Classification
Create a confusion matrix similar to logistic regression.
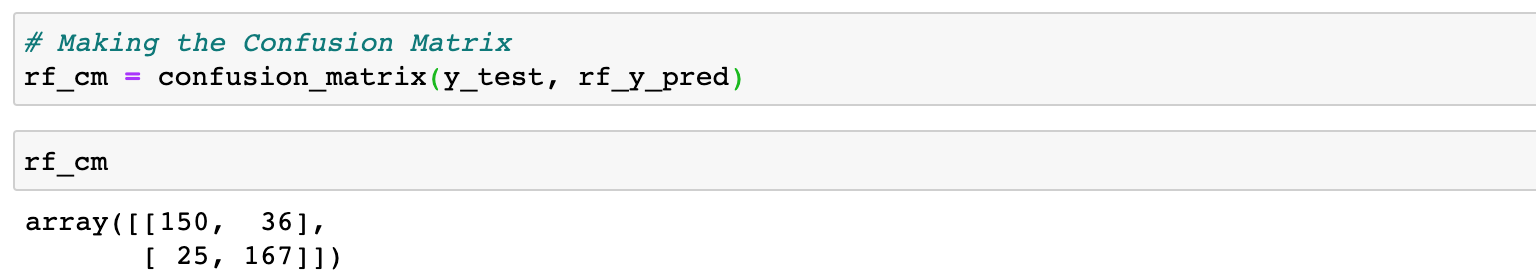

Random Forest classifier gave an accuracy score of 84% which is less than the Logistic regression.
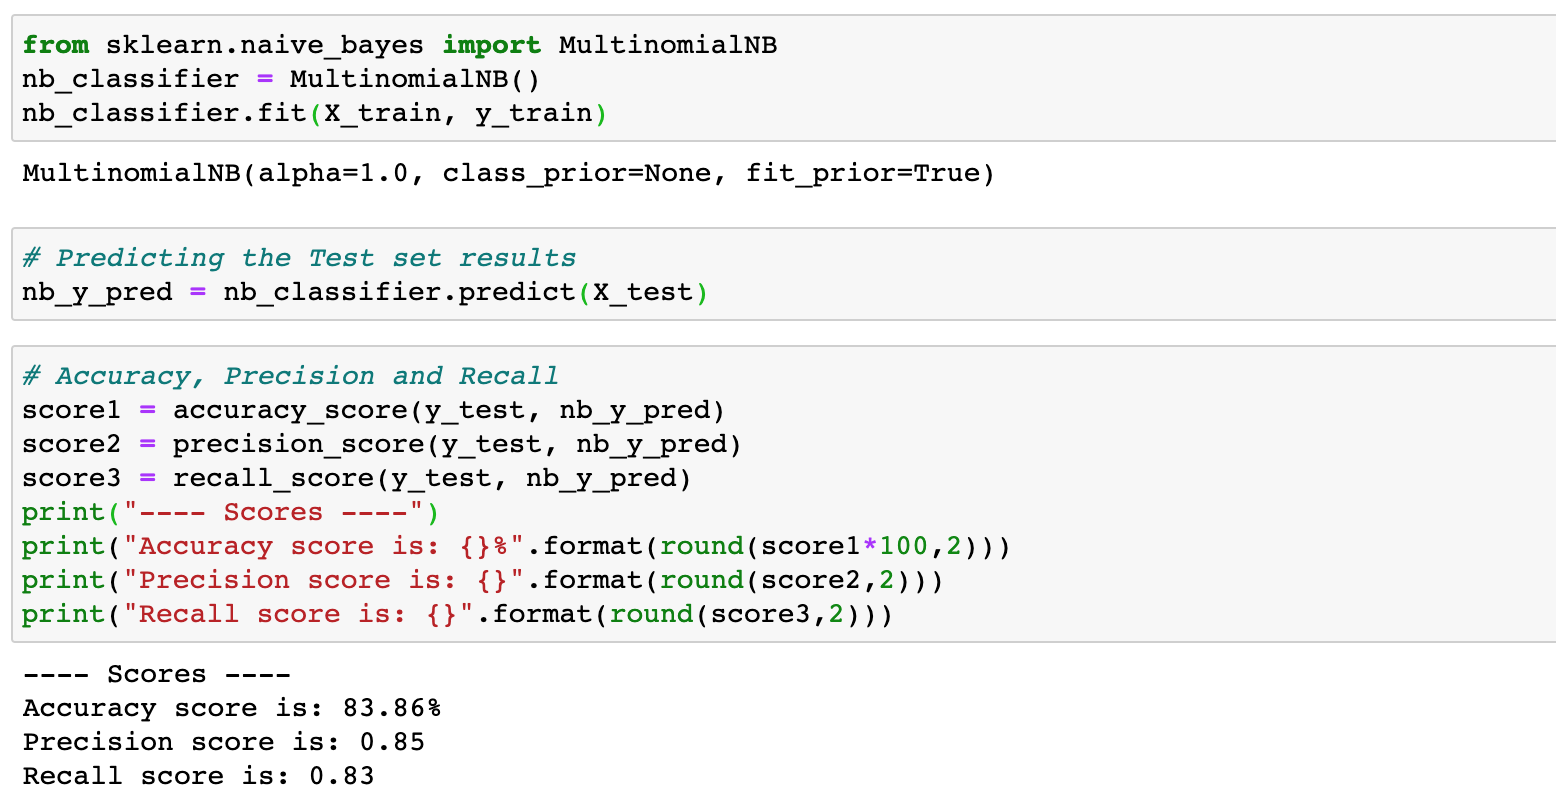
Multinomial Naive Bayes
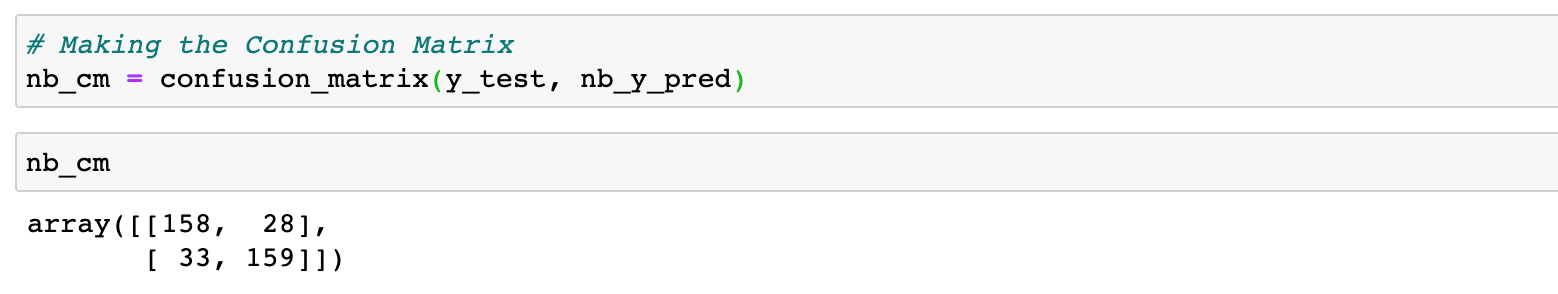
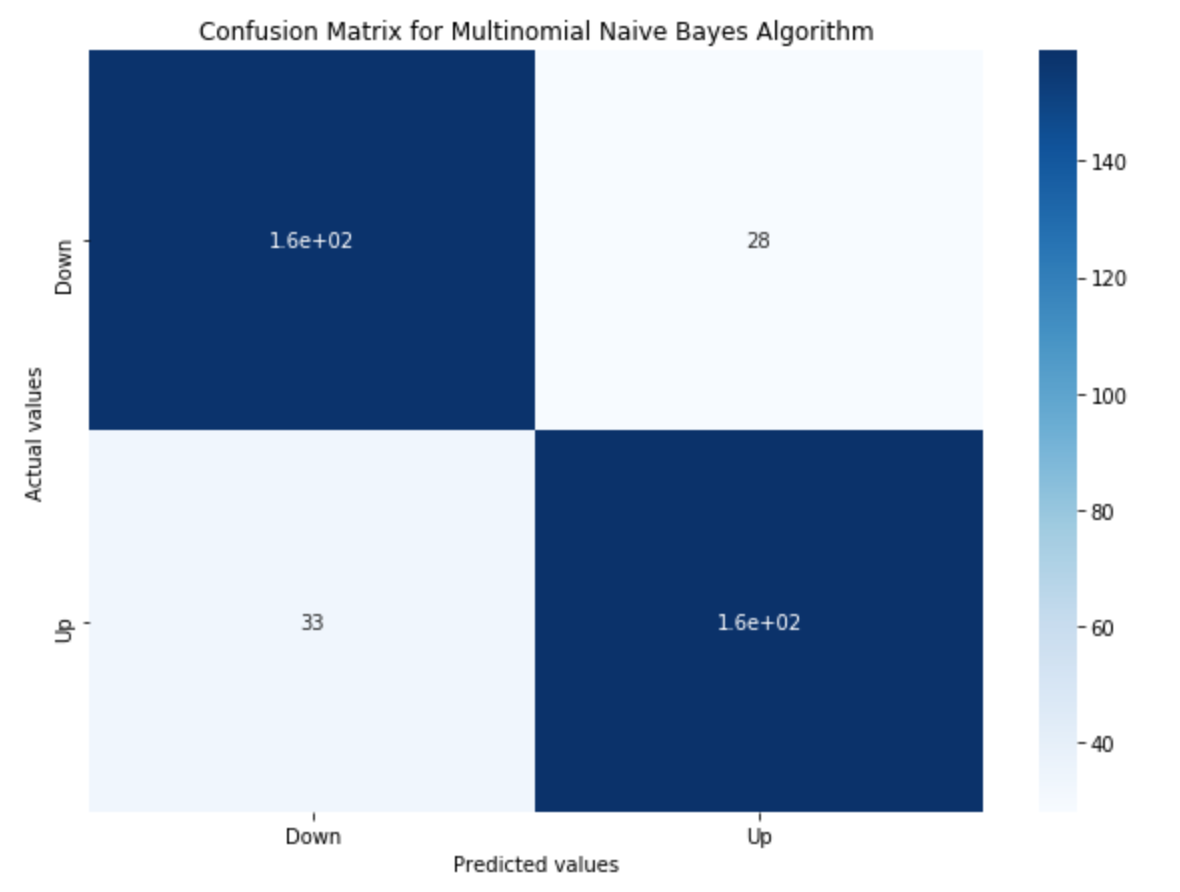
To recap what just happened, we created a Logistic regression classifier and its Confusion Matrix. We also created a Random Forest classifier and Naive Bayes classifier to see which gives the maximum accuracy.
The table below lists the different classifiers and their accuracy scores.
| Classifier | Accuracy Score |
| Logistic Regression classifier | 86% |
| Random Forest classifier | 84% |
| Naive Bayes classifier | 84% |
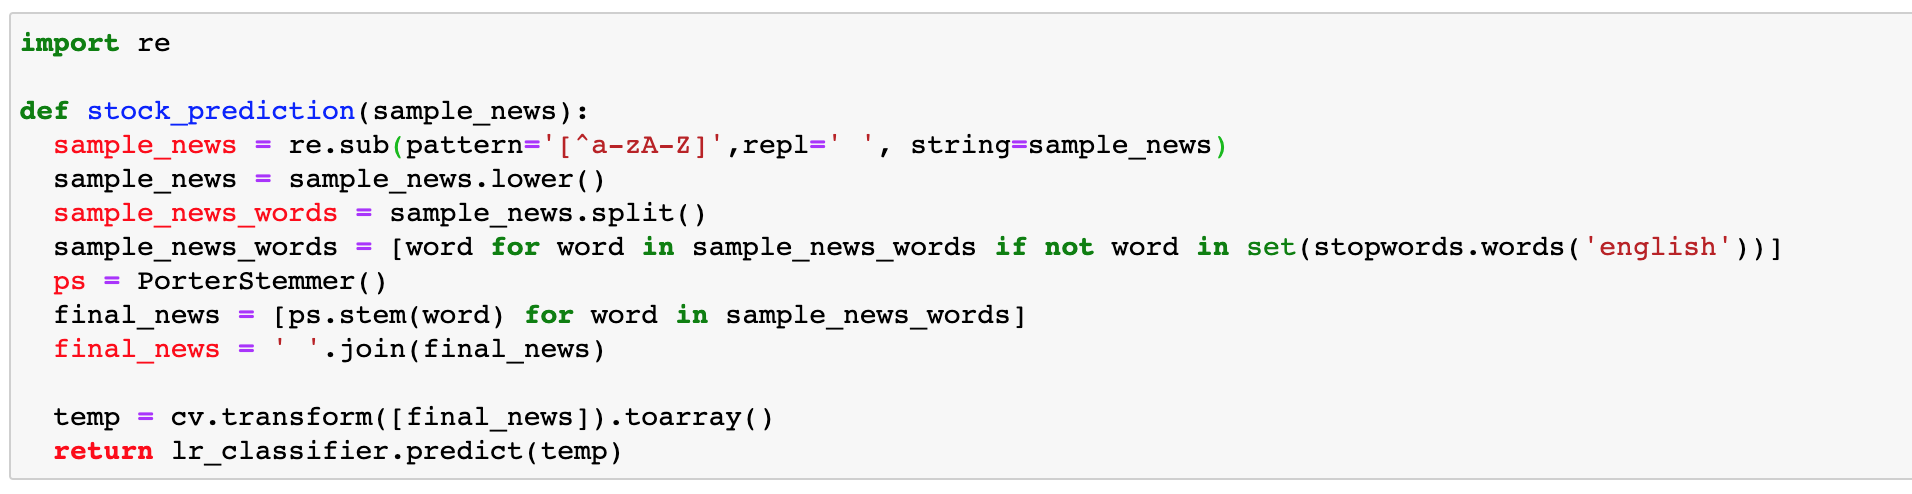
As we can see, the Logistic classifier is better than the other classifiers. So, we use the LR classifier for the predictions.
Predictions
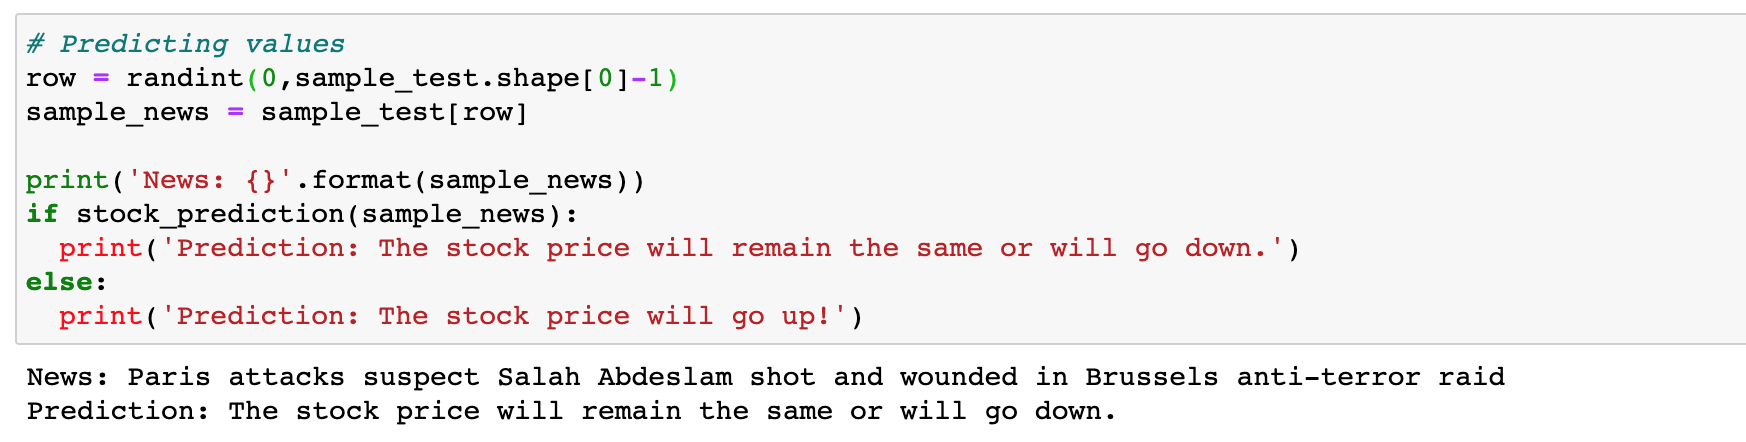
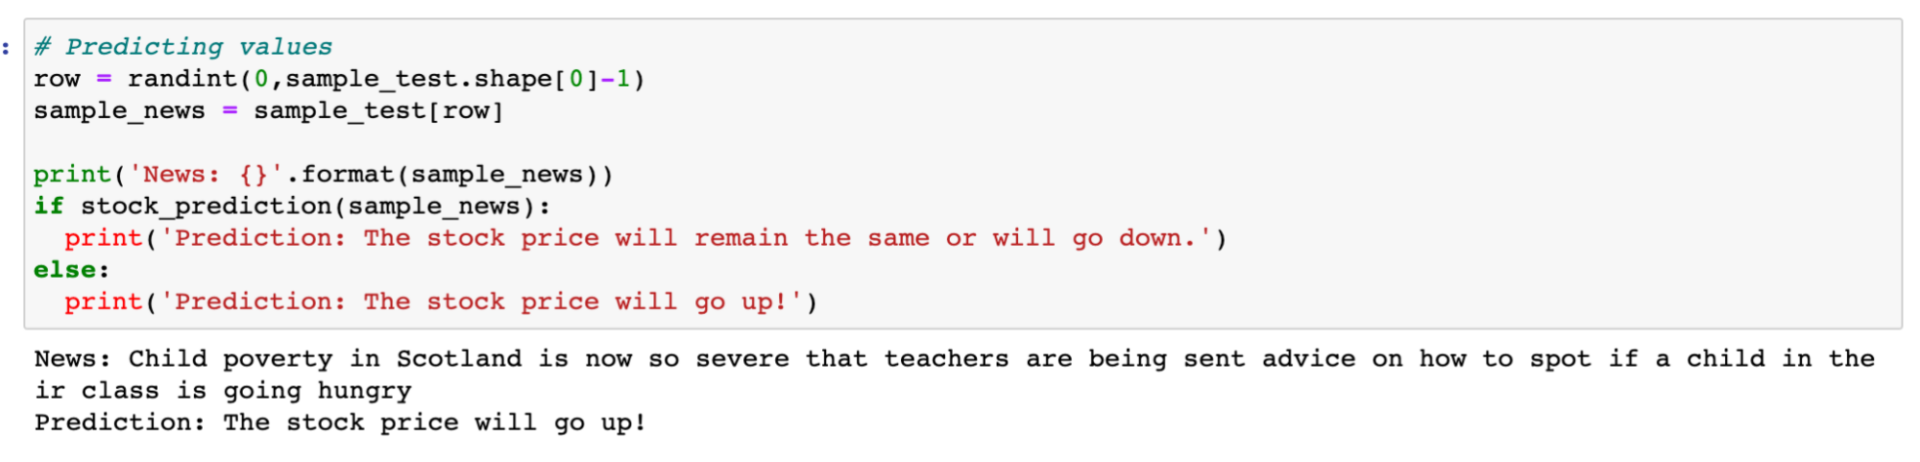
We can build a function to put all the steps in one place and test some of the headlines to see if the stock price will go up or down.
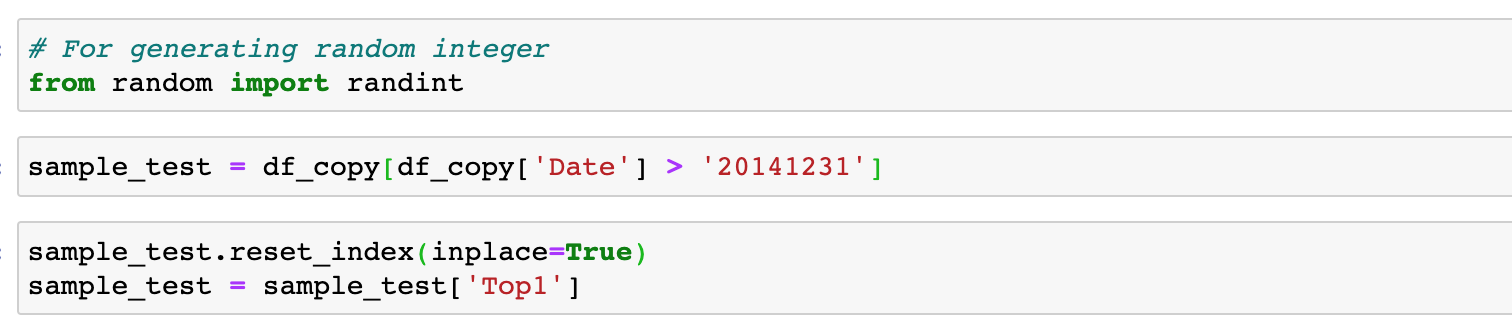
Example 1:
Example 2:
Drawing insights from social media posts and other sources is imperative for businesses in this information age because an abundance of information is generated in mere fractions of seconds on the Internet. In this blog, we have covered what Sentiment Analysis is, and how we can analyze given data using Python. However, these were just some basic ways to perform sentiment analysis. We can explore more models to use on our data.
If you have any questions about this blog or need help with sentiment analysis and other machine learning services, please contact us.